ALGONQUIN COLLEGE WORKFORCE DIVERSITY REPORT 2023

All data as of April 19, 2023, as provided by employees in the 2023 equity census. The equity census surveyed all 3,462 active employees, 2,700 employees responded to some or all of the questions resulting in a 78% response rate. Employees on Long Term Disability, Contractors and Students are not reflected in this data. Each question was asked independent of one another, respondents may have declined to answer any individual self-disclosure question. In each case, n= the number of respondents who self-identified in each category.
Click below to download the Summary Report Infographic:
Algonquin College Workforce Diversity Summary Report Infographic
Whistle Group Navigation Instructions: The below groupings of information are expandable and collapsible. Click each of the plus or minus buttons next to the headings of each expandable grouping to open or collapse the info boxes.
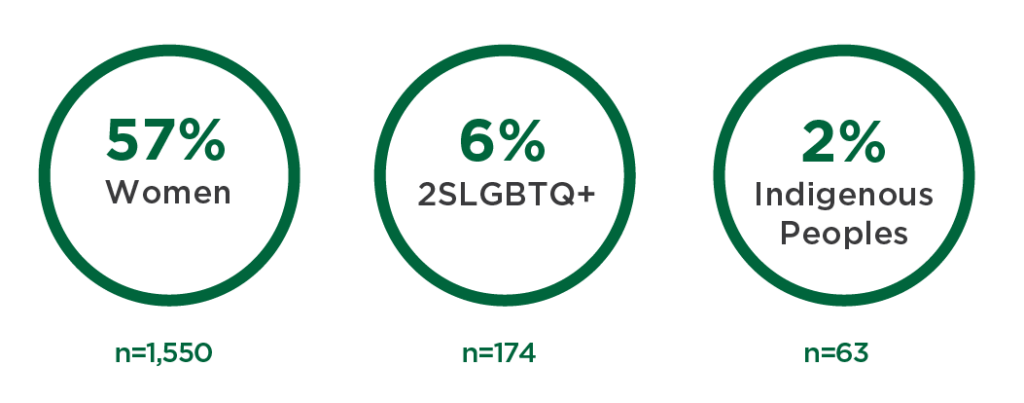
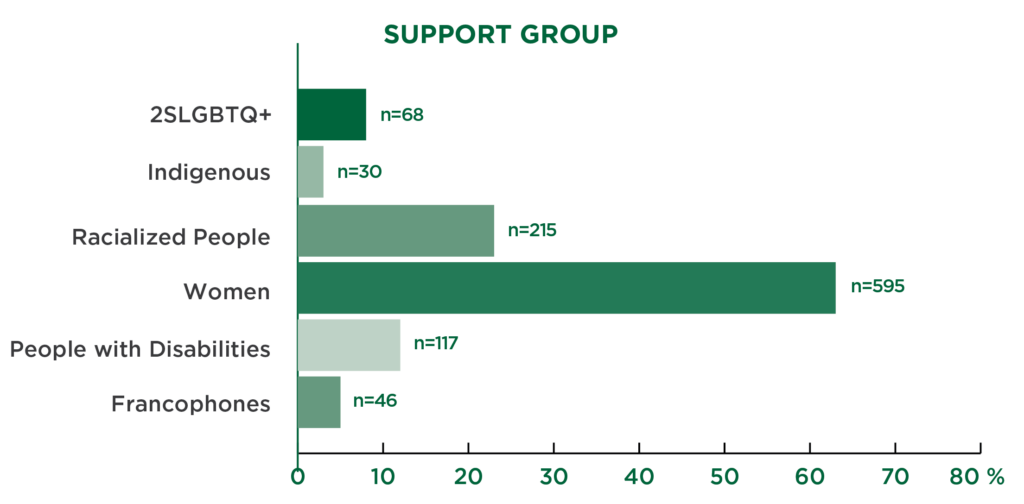
A Snapshot of Diversity in Our Workforce
The following charts give a snapshot of the current representation at Algonquin College of historically underrepresented groups. We define these groups below and break down their numbers throughout this webpage. The College will continue its efforts to support a culture where all employees are included and belong.
Gender Identities & Sexual Orientations in Our Workforce
Employees were given the opportunity to share more about their gender and sexual identities, as visibility is an important aspect of inclusion. Their willingness to share is a positive sign of trust in our Inclusion, Diversity, Equity and Accessibility efforts.
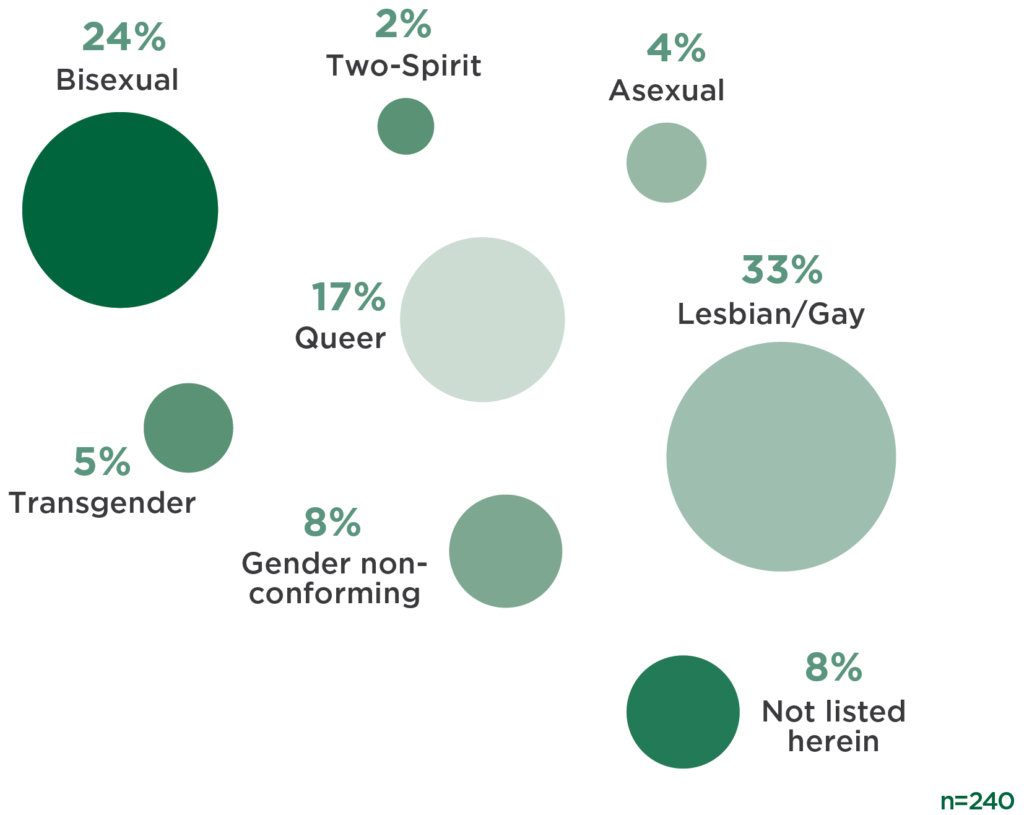
Note: Respondents who shared an additional identity may have selected one or more minority gender or sexual identities.
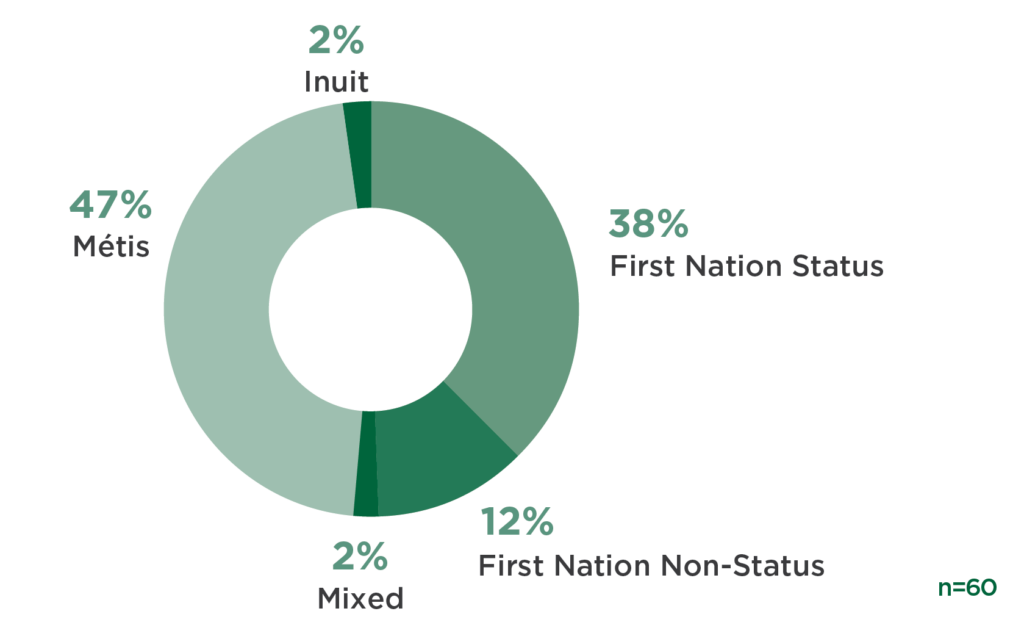
Indigenous Identities in Our Workforce
We welcome the many Indigenous communities that are part of the College workforce and recognize that Indigenous Peoples have the right to the dignity and diversity of their cultures, traditions, histories and aspirations.
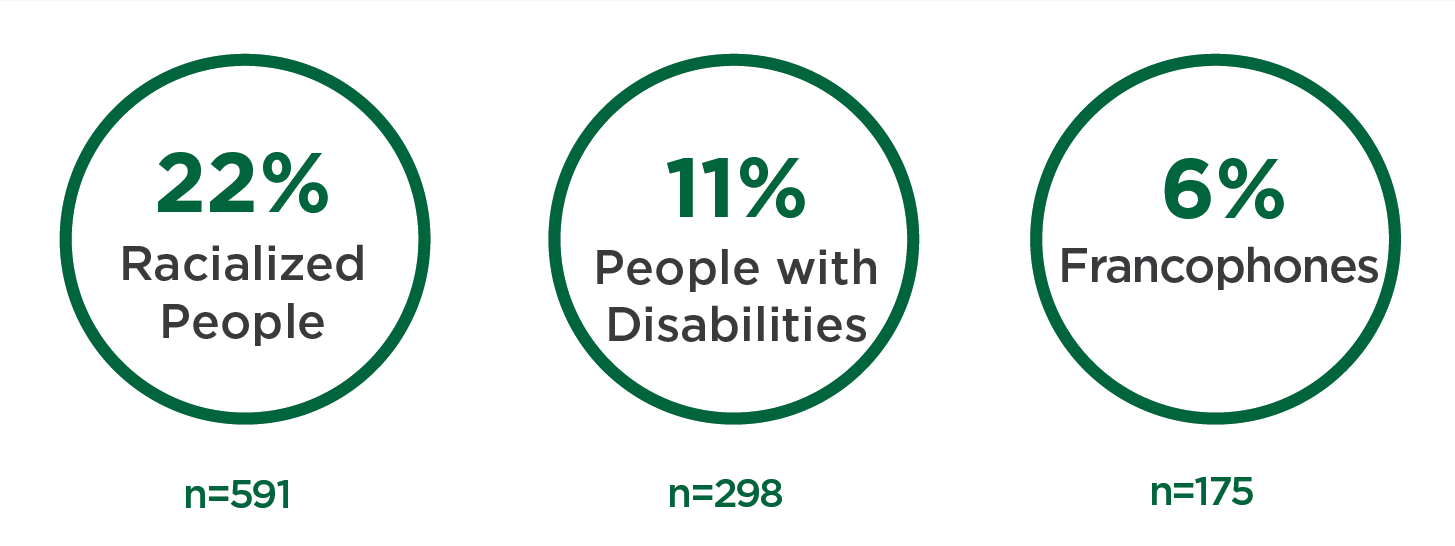
Racial and Ethnic Composition of Employees
Algonquin College will continue to work to support and grow the representation of cultural, racial and ethnic diversity in our workforce to better reflect the communities we serve.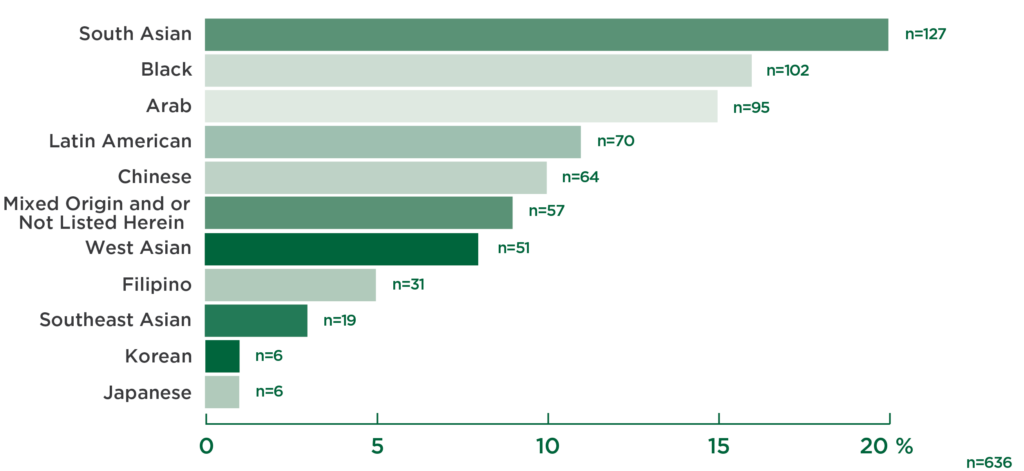 Note: Respondents were able to select one or more racial identities. Categories were adopted from those used by Statistics Canada.
Types of Disability in Our Workforce
The College has been successful in recruiting and retaining People with Disabilities, and the results are a continued motivation to ensure that the experiences of these employees is one of dignity and inclusion – and will inform our continued efforts in accessibility and improved accommodations.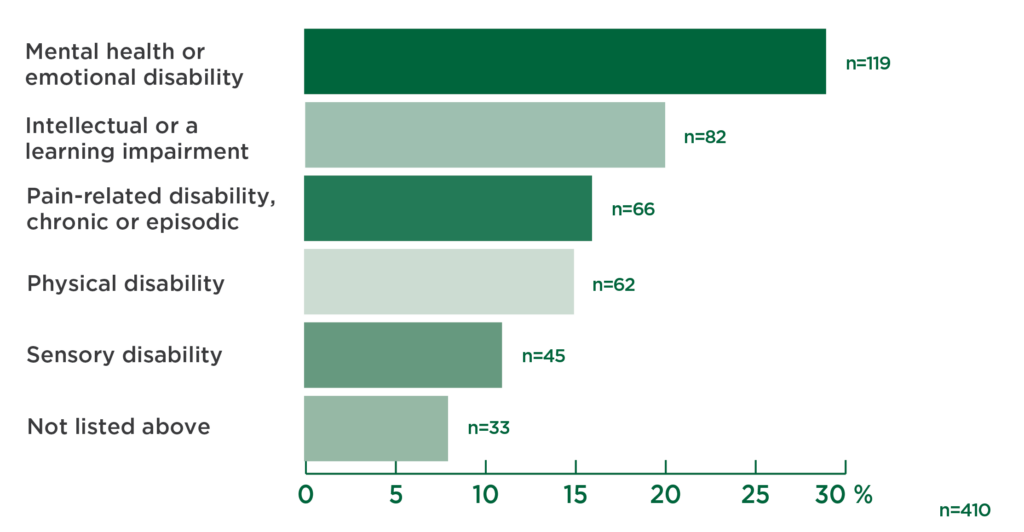
Note: Respondents were able to select more than one category of functional limitation.
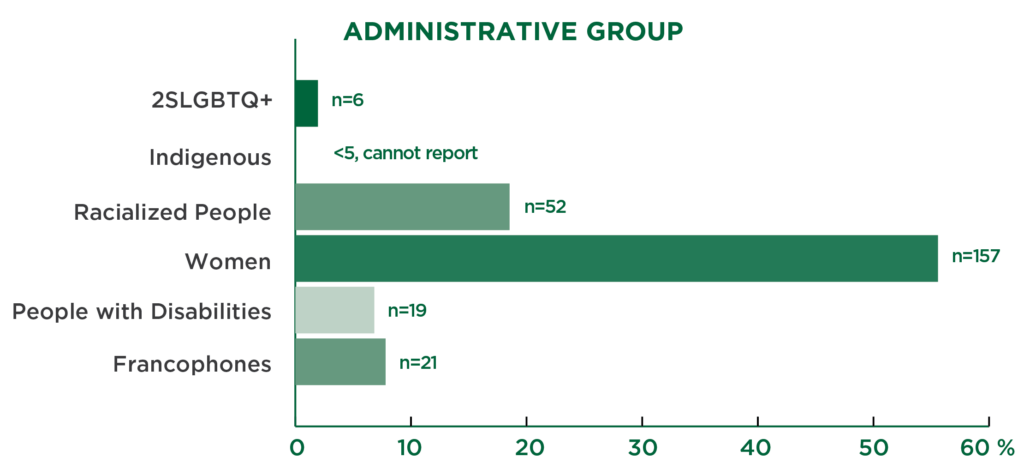
Representation of Equity Deserving Groups by Employee Type
The below charts show the representation of each equity deserving group as a percentage of the three employee types, individuals can self-identify in more than one category. We strive to balance the representation across our employee groups, and aspire to increase the diversity found in our Administrative positions.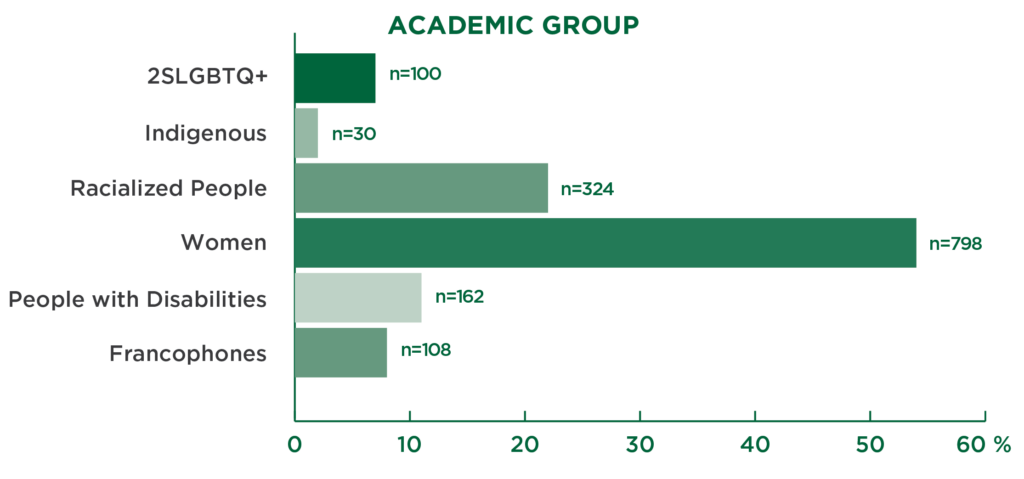
Relevant Definitions
2SLGBTQ+: a person who does not identify as cisgender and/or heterosexual (these may include but are not limited to people who identify as gay, lesbian, bi-sexual, two-spirited, queer, trans-gender, gender fluid, nonbinary, etc.) The terminology used is not meant to label individuals but rather to be helpful functional descriptors. They are not standardized and may be used differently by different people and is deeply personal.
Disability: Persons with Disabilities are persons who have a long-term or recurring physical, mental, sensory, psychiatric or learning impairment who,
a) consider themselves to be disadvantaged in employment because of that impairment, or b) believe that an employer or potential employer is likely to consider them to be disadvantaged in employment by reason of that impairment, and includes persons whose functional limitations owing to their impairment have been accommodated in their current job or workplace.
Francophone: a person who belongs to a population using French as its first or sometimes second language. In the OPSEU Academic Collective Agreement, Francophones are identified as an equity deserving group.
Indigenous Peoples: Indigenous (Aboriginal) people are persons who are First Nations, Inuit or Métis, Status or Non-Status.
Members of racialized minorities (visible minorities): means persons, other than Indigenous (Aboriginal) peoples, who are non-Caucasian in race or non-white in colour. A person may be a member of a racialized (visible minority) group regardless of their place of birth or citizenship.
Women: a designated group under the Employment Equity Act. The Act does not define the term ‘woman’ and neither do we.